Tables and figures: Why are graphics taken for granted in research writing?
Writing a scientific paper is as complex as it is gratifying.
To take one on, researchers have to complete literature reviews and orchestrate tests — which they have to design, conduct, and debug. After that, they write pages upon pages of dense text, respond to peer feedback, and more before they can get their foot in a journal’s door.
That’s enough screen time to make one wish for blue light-blocking glasses and a few days staring out at Walden Pond.
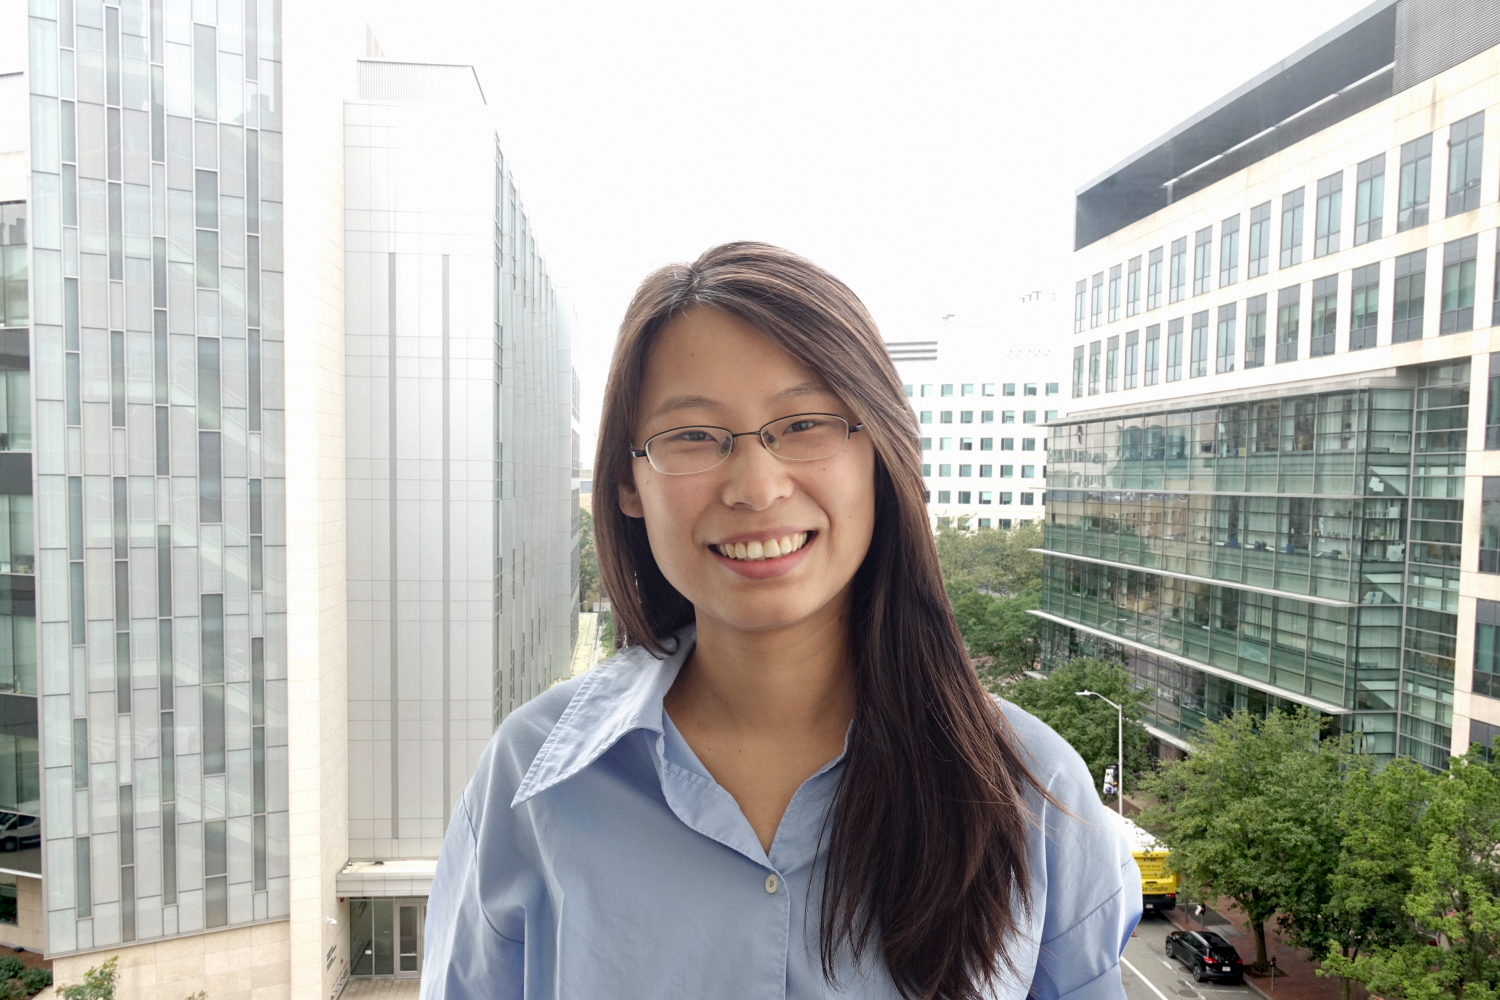
According to Miaomiao Zhang, a postdoc at the MIT Concrete Sustainability Hub and in the Department of Civil and Environmental Engineering, something that often gets lost in the shuffle of writing a paper is a concern for the figures and tables inside it.
“When researchers take on a paper, I find that we focus a lot on the writing process. This is to be expected, of course, but I find that we can obsess over the language of our papers to the detriment of the big picture,” observes Zhang, whose research at the MIT Concrete Sustainability Hub focuses on the sectoral environmental footprints and avoided emissions associated with paving materials decisions. “I feel that civil engineers are especially likely to fall into this trap.”
If you skim a few civil engineering publications and compare them to top journals in disciplines like biology or chemistry, you might notice that the graphics in the former tend to be less sophisticated.
“You can tell that authors in different disciplines emphasize different things. Civil engineers tend to take less pride in their figures, which they frequently make in Excel rather than a graphics program,” she adds.
To Zhang, this is a stumbling block for civil engineering research, as poor figures can make even incredible work less accessible. She is attempting to change this, one engineer at a time.
“At the Concrete Sustainability Hub, I am notorious for being a stickler about quality figures. I am always commenting on my fellow researchers’ charts and tables while offering to help make them better. I feel that it’s my responsibility toward them to help make their work as accessible as possible, so that we can all grow as a research community.”
While researchers often crowd her desk at the Materials Systems Laboratory to ask for help, she didn’t always place importance on the graphics component of research writing.
Up through her PhD, Zhang preferred to keep her figures bare-bones, thinking of them as secondary to her writing.
“I was perfectly happy to make my figures with graphic programs like R, Python, and PowerPoint. Then it struck me that I could more effectively communicate my research if I took the time to thoughtfully lay out my tables and charts and do my best to draw graphics. I still wouldn’t say that I’m good at it, but the effort is what matters!”
Zhang credits her close friends with giving her a passion for figure design, which she describes as infectious. “As scientists, we have to feed off the passion of our peers to make it far,” she notes.
One day, Zhang hopes to take her communication-first approach to research to her own lab.
“A goal of mine is to become a professor or research scientist who is really there for my students. Especially the ones early in their academic careers, who need the most help and motivation. I want to push my students beyond being ‘good enough,’ encouraging them to take on topics with their best effort.”
“I think that my current advisor, Dr. Randolph Kirchain, is a good model for the type of advisor I’d want to be. He takes entire days to hear about what each of us is working on and is patient. He reminds us that we should be focusing on conveying our research, and not just performing it,” she adds.
Zhang credits her father for giving her the drive to become a high-performing academic. “He will always think of me, and I hope through my work I can meet his expectations to become the best I can be.”
Ultimately, if you ever find yourself in Zhang’s lab, be prepared for a crash course in graphics. One figure at a time, she is changing the landscape of civil engineering research for the better.
Share on Bluesky